In recent years, a new tool has come onto the market that is becoming increasing useful and popular for monitoring a network. This tool is known as Splunk (I presume that the name is a play on the word “spelunking” or cave exploring). Splunk is really a simple idea whose time has arrived. It collects the voluminous machine data (that overwhelm even the most time tested security engineer) and indexes it for searching and analysis much like Google does for the Internet. Obviously, such a tool can be invaluable in security monitoring of a network.
One of the great strengths of Splunk is its ability to gather machine data from multiple machines, on multiple networks, across multiple platforms and make it available for the security engineer to make sense of. One of the great challenges of security monitoring is the vast amount of machine information that is available and multiple locations. In most cases, the machine generated data is substantial and beyond the capabilities of a single security or network engineer.
Splunk is not really a good tool for real-time monitoring of security, but rather an after-the-fact recreation of what took place. If Splunk is utilized daily, for instance, it can help us identify that an attack has taken place, when it took place, how it took place, and possibly, who did it.
The first step, of course, is to download and install Splunk. The Splunk Enterprise version is still free and you can download it at www.splunk.com.
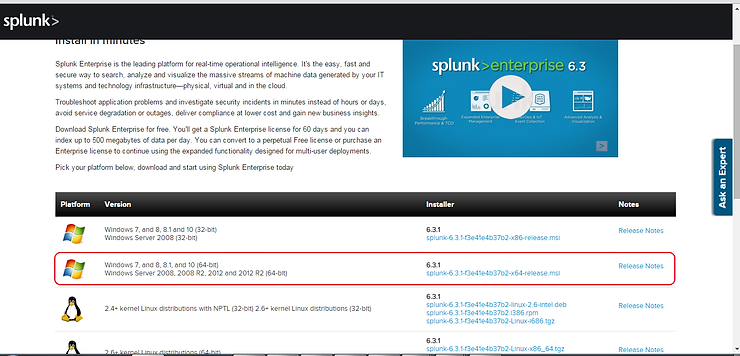
Installing Splunk
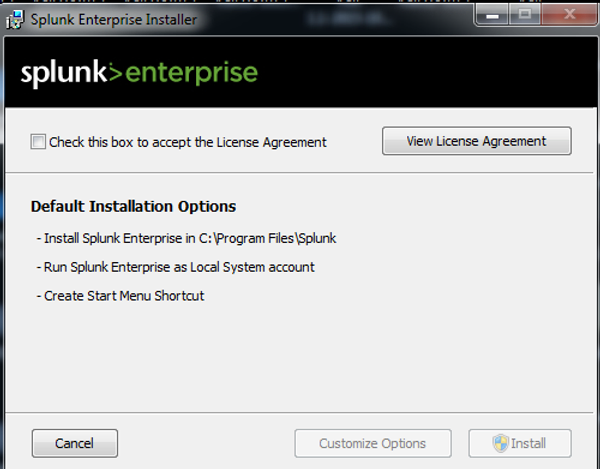
Once the .msi file has completed downloading to your system, open the msi and start the install. Then, simply follow the steps detailed by the wizard to complete the installation of Splunk Enterprise.
Login Into Splunk
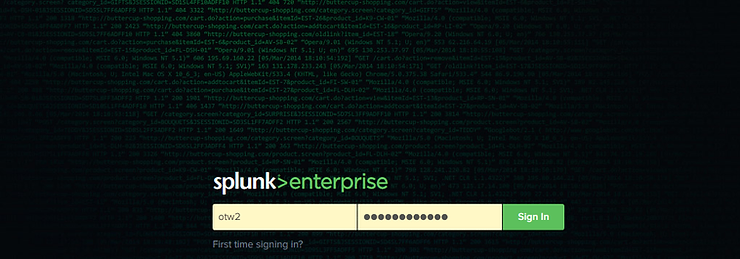
After Splunk has completed its installation, it will open a login interface with your default browser like that shown below.
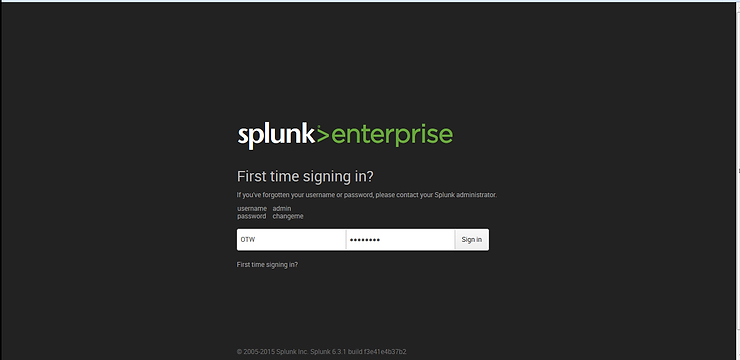
The first time you login, you must use the default username and password. These are;
username = admin
password = changeme
Once you have logged in with these credentials, you should change the password to a unique and secure password
Using Splunk for Security Monitoring
When you initially log into Splunk, you will be greeted with a web-based GUI interface like that below. In this interface, we have four choices, Product Tours, Add Data, Splunk Apps and Splunk Docs. To start, we need Splunk to gather data for us. To do this we need to click on “Add Data” icon.

Once we click on the Add Data icon, Splunk gives us multiple choices of data sources we can choose from. These include;
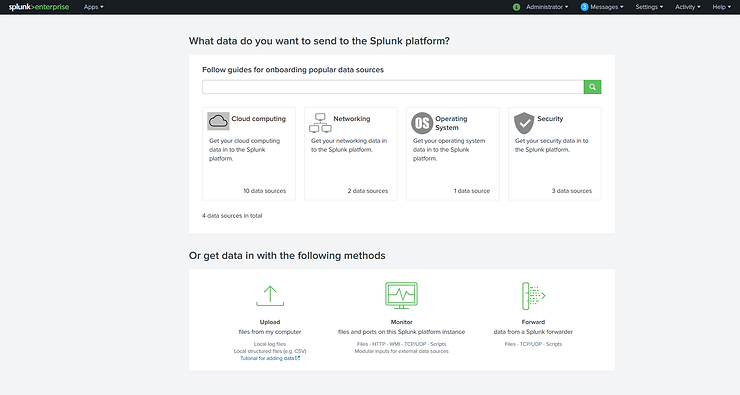
Next, let’s click on the “Monitor” method at the bottom in the middle.
Local Event Logs
Remote Event Logs
Files and Directories
HTTP Event Collector
TCP/UDP
Local Performance Monitoring
Remote Performance Monitoring
Registry Monitoring
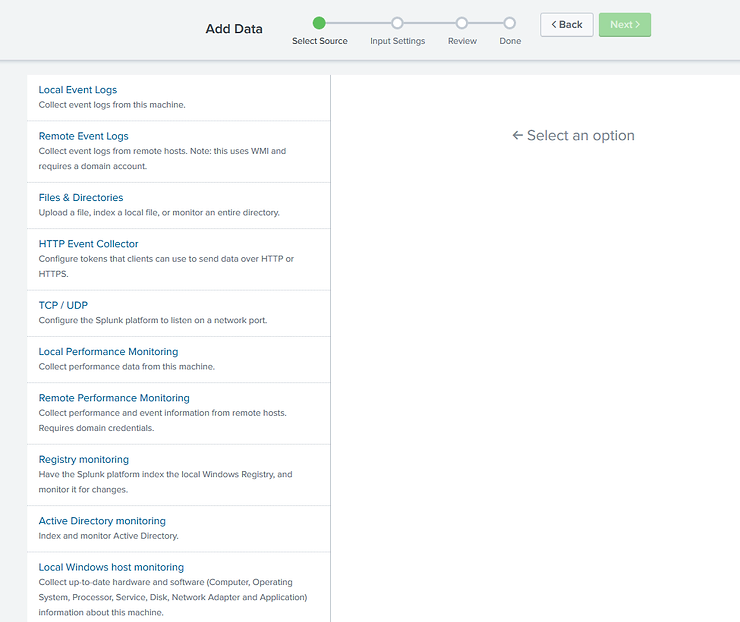
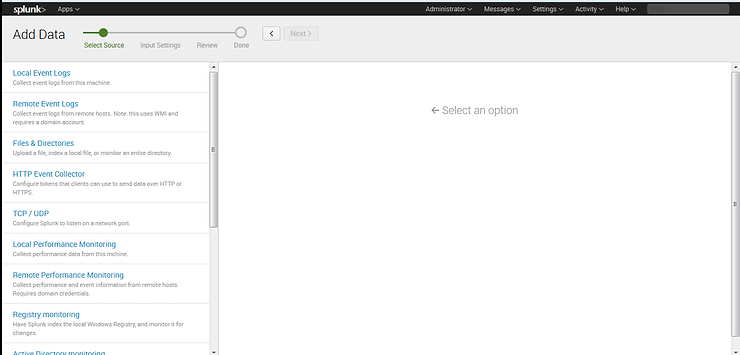
Initially, lets simply add data from the logs of our local machine. In future tutorials, we will add other data on the network, but for now, let’s keep it simple. Click on the Local event logs icon and it will open a screen like that below.
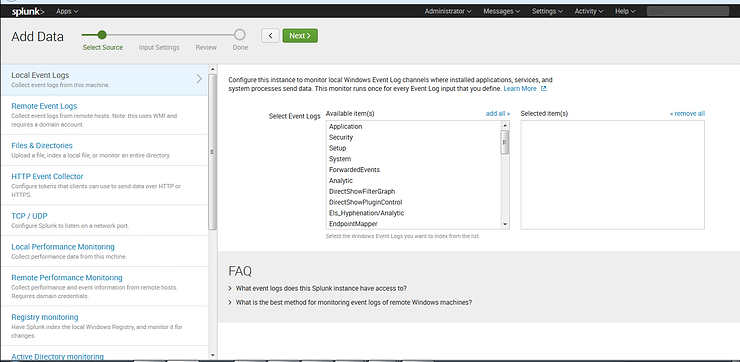
As you can see, Splunk offers us many choices of event logs. In this case, simply select “System”, “Security” and “Application” logs and then click “Next”.
Splunk will now gather all this log data for us and index it for searching.
Searching the Machine Data
Now that Splunk has gathered all the data, we can search it for specific information that may indicate various security breaches.
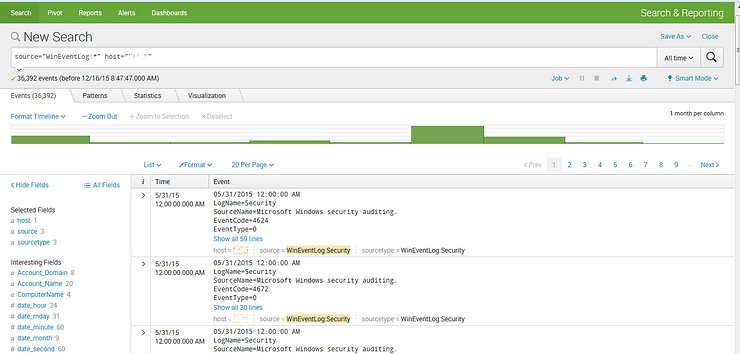
Before we do that, let’s ask Splunk to look for patterns by clicking on the second tab at the top of the window.
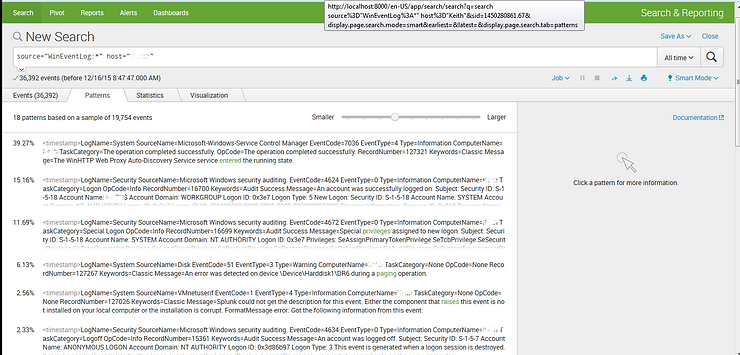
Here, Splunk will look through the events and try to find patterns and categorize them for us. As you can see above, Splunk has found 18 patterns among 19,754 events.
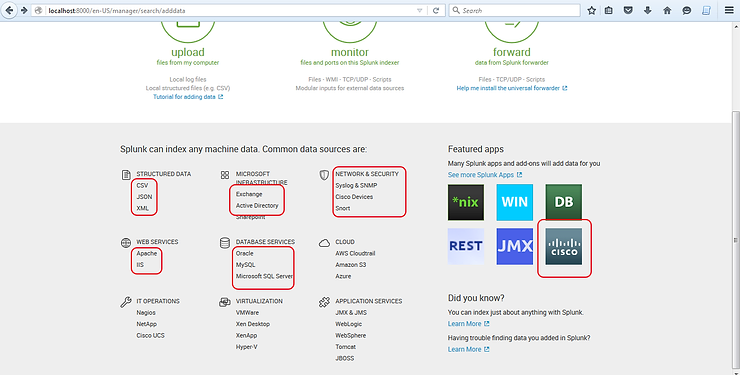
Splunk is also capable of gathering data from many other sources including;
Web Services
Exchange
Active Directory
Databases
Virtualization Systems
Syslog
Cisco Devices
Cloud
and other Application Services.
In future tutorials in this series, we will examine more advanced ways to search the indexed data (Search Processing Language) to decipher what security events took place on your systems and network and varied ways and sources of data that can be used with Splunk.

