Welcome back, my greenhorn hackers!
In an earlier tutorial, I introduced you to Splunk for Security Monitoring. In this installment, we will examine the Splunk Processing Langauage or SPL. This is the language built into Splunk for searching for specific information among all the machine data that Splunk has gathered and indexed for us. Without this language, we would have gathered vast amounts of machine data with no way to find specific information related to our security issues.
Before Splunk, we had data distributed throughout network and systems. This data can be invaluable in security monitoring or incident response. After Splunk’s data gathering activities and indexing, now we have all the data in one place, but we need a way to query or search that data. That is where the SPL come in. Splunk’s SPL has many similarities to the relational database language, Structured Query Language, or SQL. This should not be surprising as Splunk is essentially creating a database of your machine data.

Getting Started with SPL
Here, I have once again gathered data from my log files (refer to part 1 of this series on how to add data) and now I want to search through all those records for specific data. As you can see in the screenshot below, Splunk has gathered over 80,000 events!
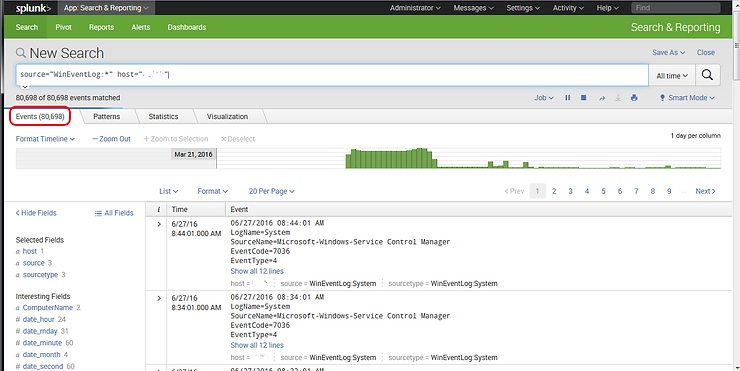
The beauty of Splunk is its ability to gather all that machine data and index it. Now that the data is indexed, we need the tools to find specific records.
If you look to the left-side panel, you will find that Splunk has listed numerous fields that it terms “Interesting Fields”.

This list includes only the fields that Splunk deemed “Interesting Fields”, but when I scroll all the way down to the bottom of this list, I see that Splunk indicates there are 214 more fields. I can use any of these fields in my queries in the SPL.
With all this data available now, let’s see if we can find specific events that are of interest to us. This specific machine hosts an Oracle database server instance. Let’s search for specific information regarding that database server, using the Splunk Processing Language.
The name of my Oracle database instance is “orcl” (that’s the default name for Oracle instances). Let’s search for any events relating to it among these 80,000 events. In the search window above, simply type “orcl” to see whether we can find any events relating to this database server.
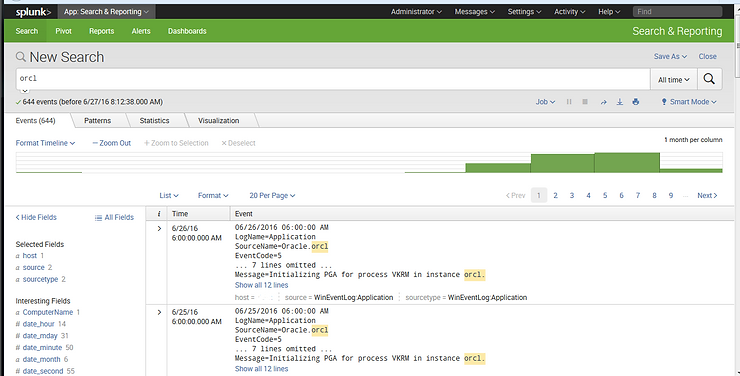
As we can see above, Splunk has found 644 events that include the term “orcl”. That’s a much more manageable number than the original 80,000.
Boolean Expressions In SPL
The Splunk Processing Language enables us to use three types of Boolean operators.
1. AND
2. OR
3. NOT
Please note that all Boolean operators must be in caps or else Splunk will treat them as just another value to search for. It’s also important to note that the default operator is AND. This means that if we include more than one term in the search field, SPL will treat it as an implied AND between them.
So, if we want to find all the events that included “orcl” and included the term “pga” (PGA or program global area is memory structure in Oracle that contains a server process), we could simply type both of those terms in the search field and Splunk would put in the implied AND.
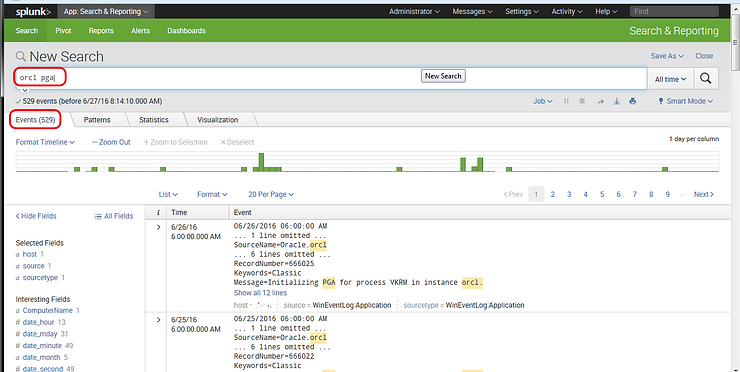
As you can see above, this new search has reduced the number of events to 528.
By the same token, if I wanted to find all the events that include “orcl” and “sga” (SGA or system global area is a memory area that contains the data and control structures of a single database instance), I could type both of those terms into the search field and ask Splunk to return to me the result set where both of those terms appear, such as below.
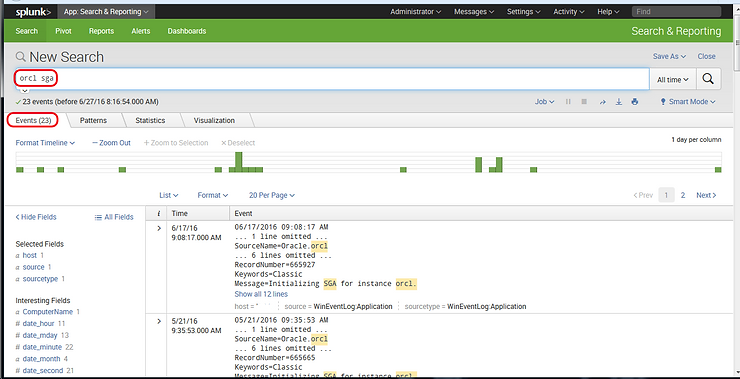
This search narrowed down the number of events to just 23.
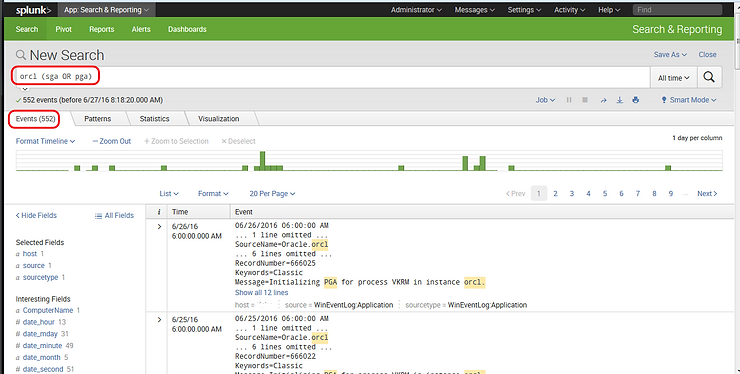
Now, let’s suppose that I want to find all the events that generated by this Oracle database server instance named “orcl”, but I also wanted only those events that included “sga” or “pga”. I could construct a search query like that below.
orcl (sga OR pga)
Now, Splunk would search for all events that included “orcl”, but also included “sga” or “pga”. Its important to note that there is an implied AND between the orcl and the left paren (. Its also important to note that I put the parens around the OR statement. Logical AND’s take precedence over OR’s, so without the parens, the statement would be interpreted as
(orcl AND sga) OR pga
This would give quite a different result set.
Pipes
Just like in the Linux/Unix command line, we can pipe commands together. This means that the result set of the left command is then sent (piped) to the right side command. Splunk then returns the result set from the right side command. Among other things, the pipe command can be used to sort the results from your first (left) command.
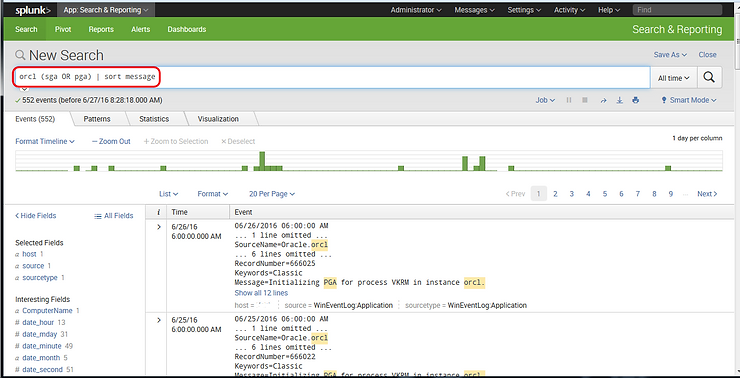
Suppose we wanted to sort our results from our earlier searches by the “Message” field. We could do that by creating the following SPL command.
orcl (sga OR pga) | sort message
This command will look for all events that have “orcl” in it and have either “sga” or “pga” and then pipe those results to the sort command and it will sort the result set in ascending order by the message field.
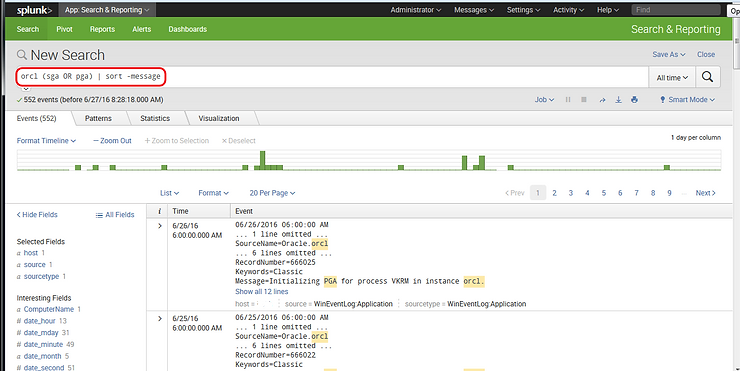
We can reverse the order of the sort (descending) by placing a minus sign (-) before our sort field.
orcl (pga OR sga) | sort -message
The Splunk Processing Language is a powerful, yet simple language for searching the machine data that Splunk gathers. Similar to SQL, the database language, it enables us to narrow the result set to specific events and fields. Without it, we would have a difficult time processing all the data that Splunk gathers to find specific events and we would be mired in a huge amount of data with no good way to find specifics.
In a future tutorial, I will demonstrate some more advanced SPL and advanced Splunk, so keep coming back my greenhorn hackers!


