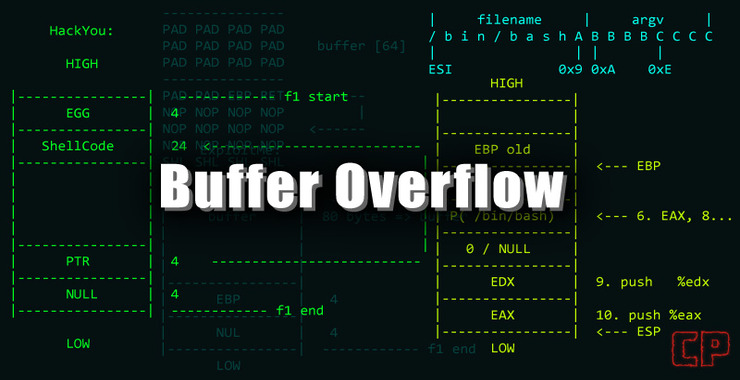
Introduction Buffer Overflows
Buffer overflows are probably the most insidious type of attack. A buffer overflow is basically when a memory area is given too much data for the allotted space and the memory area overflows. This overflow can then enable the attacker to execute their own specially crafted code. The attacker’s code is often a rootkit or other shellcode that enables the attacker to control the system, remotely.

In this article, I will attempt to convey a rudimentary understanding of a very complex subject. I hope sometime in the future to offer a more advanced course in buffer overflows here at hackers-arise.com, where we could dedicate more resources to this subject alone, but here in a few lessons I want at least leave you with an understanding of;
1. What a buffer overflow is
2. The risks of buffer overflows
3. The basic mechanism of buffer overflows
4. How to fuzz to find buffer overflows
5. The basic terminology and concepts in this field
6. The tools used to analyze and debug code
7. Writing a simple buffer overflow
8. Writing shellcode
Some Definitions
To be able to understand buffer overflows, we first need to define a few terms. Understanding buffer overflows and exploit development requires a more intimate familiarity with the inner architecture and working of the CPU , its memory registers and how they handle instructions and data. Here are just few of the terms you must familiar with to be successful in these module.
API – Application Programming Interface
Assembly Code – low level programming language with a fewvery simple operations
Big Endian – the most significant byte is stored first
Buffer – an area of memory allocated with a fixed size
Byte Code – code written in a high level language
Compiler – a program that converts high level language to machine code
Debugger – software that allows us to debug problems in our code by either hooking onto the runtime environment of the application or running it in a virtual machine
Disassembler – a software tool to convert compiled programs to machine code
DLL – a programming component in Windows systems that contains functionality used by many programs
GDB – the GNU debugger (GDB) is the de facto debugger on Unix and Linux systems. We will be using it later in the module
Heap – a memory area allocated dynamically
Interpreter – reads and executes program code line by line without saving it for re-use. Interpreters make platform independence easier.
Little Endian – the least significant bit is stored first. x86 systems are little endian
Machine Language – code that can read and understood by the processor
Malloc – a function call that allocates n number of bytes on the heap
Memset/Memcpy – memset is a function used to fill the heap with a specified number of bytes while the memcpy copies a specific number of bytes from one buffer to another
printf – the most common LIBC function for outputting data
Sandbox – a controlled environment for executing code that does not allow the code to affect outside systems
Shellcode – traditionally, byte code that executes a shell. Now, it has a broader meaning. Generally, now it refers to any code that is executed to exploit a system
Signed – signed integers have sign bit to denote the integer is signed. Data can either negative or positive.
Stack – an area of memory designed to hold temporary data
strcpy/strncpy – both of these LIBC functions have security problems. strcpy copies data from one buffer to another without any size limitation assuring that a buffer overflow is possible. strncpy function adds a size parameter to strcpy, but can be miscalculated if dynamically generated.
Unsigned – unsigned data types either are positive or zero. Negative value are not possible.
Memory Theory
Before we delve deeper into buffer overflows, we need to first address some basics of memory theory. I know, I know…you don’t want theory and, in general, I try to avoid it, but in this case it is unavoidable. Without understanding the theory, the practical application will make no sense. Kind of like trying to network without understanding TCP/IP.
To execute a buffer overflow, we will need to manipulate the memory in such a way as to get the CPU to execute our code. Let’s start with a stack based buffer overflow, which is overfilling the memory stack and then overwriting the memory areas adjacent to the stack.
First, let’s look at how a program’s memory is laid out.

The stack grows downward. The heap grows upward. The text segment contains the program code and the data segments that contain the global information. The higher addresses are shared by the stack and the heap, both of which the systems allocates at runtime. The stack is fixed size, whereas, the heap is dynamic.
Intel CPU’s have general purpose registers that are used to store data. These include;
EIP – instruction pointer
ESP – stack pointer
EBP – base pointer
ESI – source index
EAX – accumulator
EBX – base
ECX – counter
EDX – data
All of these registers will be important to our analysis, but ESP, EBP and EIP are critically important to understanding and executing a buffer overflow.
Anatomy of Buffer Overflow
The ESP points to the top of the stack (in the diagram below, it the green area at the top) at its lowest memory address, while the EBP points to highest address at the bottom of the stack (the green area near the bottom of diagram to the right) The EIP contains the address of the very next instruction the CPU is to execute (beneath the EBP). To be able to execute a buffer overflow, we need to manipulate the EIP and get it to point to our malicious code.

When a program begins to run, a stack frame is created with local variables and is PUSH’ed onto the top of the stack. The key to the buffer overflow attack is to gain access to the EIP (the red area on the diagram) or return address. If we can gain access to it, we can then have it point to our malicious code.

When data is entered, it enters the stack in reverse order. The stack grows down toward the EBP. If we can successfully PUSH more data on to the stack that it has allocated, we can possibly push past the EBP to the EIP (red) and have the EIP overwritten and point instead to our code.

Then, the EIP will point to our code and begin execution. Voila! We have executed a buffer overflow and have gained control of the system.

Of course, this is an overly simplified concept of the buffer overflow, but we must begin somewhere. Newer operating systems have employed newer techniques to limit buffer overflow attacks (although they are still possible) such as ASLR ( address space layout randomization) and DEP (data execution prevention). In this course, we will assume that ASLR and DEP are disabled or were never implemented and save buffer overflows in those environments to a special class on buffer overflows that I hope to offer here soon.
Thanks to Mark Carvalho for the excellent graphics depicting the stack based buffer overflow.
The Threat of Buffer Overflows
When doing security research, you will often see reference to “remote code execution” or “arbitrary code” execution. In nearly every case, this is referring to a vulnerability that relies upon a buffer overflow of some kind. For instance, if we go to Microsoft’s Technet Security Bulletins, we can find numerous Security Bulletins that warn of “Remote Code Execution”. These are almost assuredly buffer overflows. Although you will see fewer and fewer of these type of Security Bulletins in recent years, they still appear quite regularly and they are almost always ranked as critical by Microsoft.

Let’s now go to www.securityfocus.com. Security Focus is probably my favorite vulnerability database simply because of how well the information is organized and it covers all types of vulnerabilities and software vendors.
Among the most troublesome pieces of software in recent years in terms of buffer overflow has been Adobe’s Flash Player. It seems that a new vulnerability is found nearly every day in Flash Player. On the day I went to www.securityfocus.com and selected Adobe as my software vendor and Flash Player as my Title, I found the following vulnerabilities as seen below. On this single day, May 7, 2015, four (4) new buffer overflow vulnerabilities were listed. You can see that each sounds a bit different from “Remote Code Execution Vulnerability”, to “Buffer Overflow Vulnerability” to “Heap Based Buffer Overflow Vulnerability”, but they are all buffer overflows. All of them are very dangerous and fall into this critical category that we are addressing in this module.

Coming Up Next
In the next few articles, we will use fuzzers to discover buffer overflows and then develop some basic buffer overflows on the x86 Intel architecture to demonstrate the principles and insidiousness of this type of vulnerability.


