Welcome back, my aspiring investigators!
Open Source Intelligence (OSINT) is a very broad field with a multitude of applications throughout information security and other fields. These applications include;
Pentesting and security assessment
Economic and financial assessments
Environmental Assessments
Crime investigations
People Searches
Thwarting hacks, scams, and other criminal activity
Journalism
The list could go on for the rest of this page but I think this suffices. For other application of OSINT, check out OSINT page.
In this tutorial, we will examine how we can use Google Earth Pro satellite images for investigations that involve changing conditions over time.
Step #1: Download Google Earth Pro
One of the best satellite image sources is Google Earth Pro. Although you can use Google Earth in your browser, when you download the Google Earth Pro application you get better performance and additional features. You can download it here.
Once you have downloaded Google Earth Pro, click on the icon and open Google Earth Pro. You should see an opening screen like the image below.

Note in the lower left corner, the option for layers. We can click on the various layers to see more detail and features.
Now, let’s first zoom into the Minneapolis area of Minnesota in the U.S. Roll the mouse wheel forward to zoom in and roll the mouse wheel back to zoom out.
Scenario #1: Economic Investigation Impact
Let’s assume you have been tasked with determining how sales at Walmart (the world’s largest retailer) in the Minneapolis area have been impacted by the pandemic. You might assume that the number of cars in the parking lot is a proxy for sales (more cars= more sales). Of course, this is not a perfect proxy but barring access to the specific financials of this store it might be the second best solution.

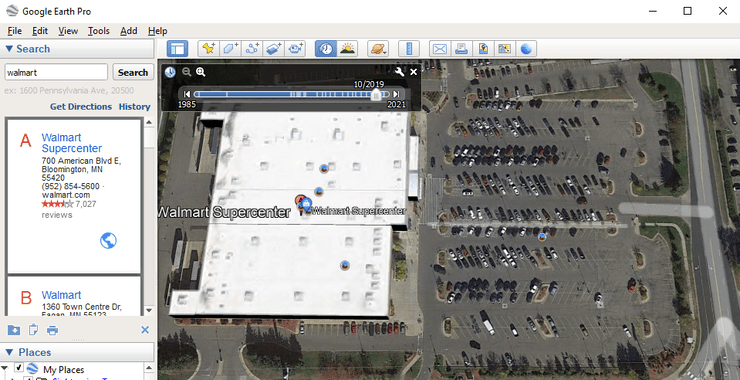
We can find the Walmart’s in the Minneapolis area by entering “Walmart” in the upper left search Window. Once we have identified a store, we can zoom into their parking lot as seen below.

One of beauties of Google Earth Pro is the ability to view the same area on the earth’s surface over time. To do so, simply click on the clock icon on the upper tool bar to open a time slider as seen in the screenshot above.
Here we can position time slider to view this Walmart parking lot on October 2019, just months before the beginning of the pandemic. As you can see, the parking is about 50% full.
Next, let’s see the same scene in the midst of the COVID pandemic. Move the slider to May 2020, the depths of the COVID pandemic. Here, we can see that the parking lot is about 25% capacity, a dramatic decline in the number of shoppers.

Scenario #2 Environmental Assessments
Although there are still a few fringe elements that deny that global climate change is taking place, nearly every reputable scientist agrees that the Co2 that human beings are putting into the atmosphere is changing our climate. You can see for yourself every day as weather events become more frequent and severe. In addition, you can use tools like Google Earth Pro to see for yourself the impacts of climate change.
The Great Salt Lake of Utah in the USA is very large inland basin without any outlets. Water drains into the Great Salt Lake from the snow melt from the mountains but there are no outlets. As a result, salt and mineral concentrations increase as the water evaporates. The basin or lake has existed continuously for about 10,000 years. In recent years, it has begun to shrink and get shallower. We can document this using Google Earth Pro.
Let’s begin by looking at 1987 satellite views of the Great Salt Lake. You can see that the main portion of the lake to the east (right) is dark green indicating it is fairly deep (the Great Salt Lake is fairly shallow compared to other lakes but the import point is its relative depth over time). You can see some blue shallow areas in the west portion of the lake (left).

If we move the slider forward to 1997, we can see that there is no longer ANY water in the west (left) portion of the lake and the deeper east (right) portion is getting lighter in color indicating it is getting shallower.

Moving forward to 2007, the lake is even lighter in color and is shrinking around the edges.

Fast forward to 2020, now major areas that had been underwater 20 years earlier are now dry, particularly in the northern part of the lake. The lake is also much lighter in color indicating that it is much shallower.

Summary
Google Earth Pro is an excellent and free tool for doing OSINT investigations particularly when looking to time-series data. Whether an economic investigation such as the Minneapolis WalMart parking lot or the environmental assessment, this is one OSINT tool you want to familiar with.
There are numerous other satellite OSINT tools, including;
Zoom Earth
Sentinel
USGS
Planet
Maxar Technologies
Look for additional tutorials using each of these in the near future.
In addition, look for our upcoming OSINT training at Hackers-Arise.


