Welcome back, my aspiring Digital Forensics Investigators!
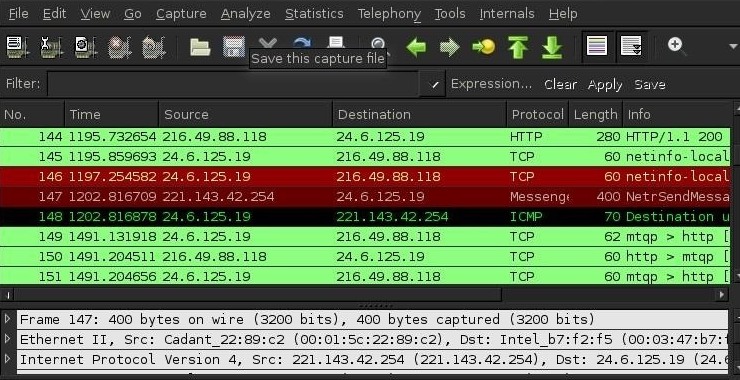
Although Wireshark is the most widely used network and protocol analyzer, it is also an essential tool to the field of network forensics. For that reason, every Digital Forensic Investigator should be proficient using Wireshark for network and malware analysis.
This tutorial is intended to provide the aspiring digital forensic investigator the basics of functionality of Wireshark so that we can use it in later tutorials to catch the bad guys.

Wireshark (formerly known as Ethereal) is a GUI-based tool that enables you to inspect network traffic and even individual packets. It is important that you understand TCP/IP to get the most out of this tool otherwise you will have a ton of information without any means of interpreting it. For some background information on TCP/IP, check out my tutorial on p0f.
Step #1: Download and Install Wireshark
The first step, of course, is to download and install Wireshark. If you are using Kali, it is pre-installed, Wireshark is available for multiple platforms (Windows, Linux, Unix, etc). Make certain you install the version compatible with your operating system. In addition, like other packet sniffing tools such as Snort, Wireshark requires either Winpcap (Windows) or libpcap (Linux) library files. When Wireshark prompts you asking whether you want to install these, make certain to say “Yes”.
A word of caution. As wonderful a tool as Wireshark is, it has had a number of vulnerabilities and exploits in recent years. As a result, never run Wireshark as system admin or root. In addition, when you are done using Wireshark, make certain to shut it down to reduce your attack surface.
Step #2: Packet Capture
After downloading and installing Wireshark, click on the Wireshark icon and start Wireshark. When you do, you will be greeted by the screen like that below.
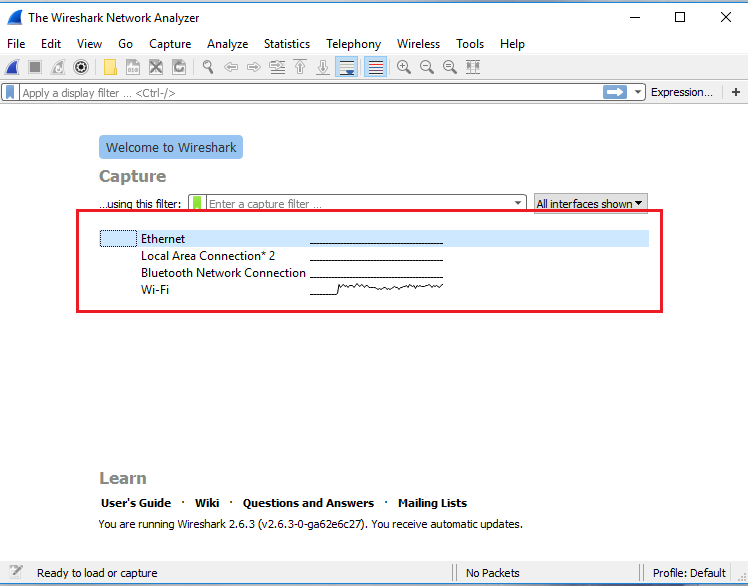
This screen enables you to select the network interface you want to capture the packets from. As you can see, Wireshark has detected 4 interfaces including;
(1) Ethernet,
(2) Local Area Connection 2
(3) Bluetooth and
(4) Wi-Fi
Yours may appear differently depending upon the network interfaces on your system. I’m connected to the Internet via Wi-Fi, so I selected and clicked on the fourth choice, Wi-Fi.
Step #3: Analysis Windows
Now, Wireshark will begin capturing packets from your network interface and packaging them into the .pcap format. This is the standard file format for packet capture (you will find it being used throughout our industry in such products as Snort, aircrack-ng and many others)
You will see three separate analysis windows in Wireshark. The top window, labeled #1 in the screenshot below, is known as the Packet List Pane. You should see color coded packets moving in real time through this window.
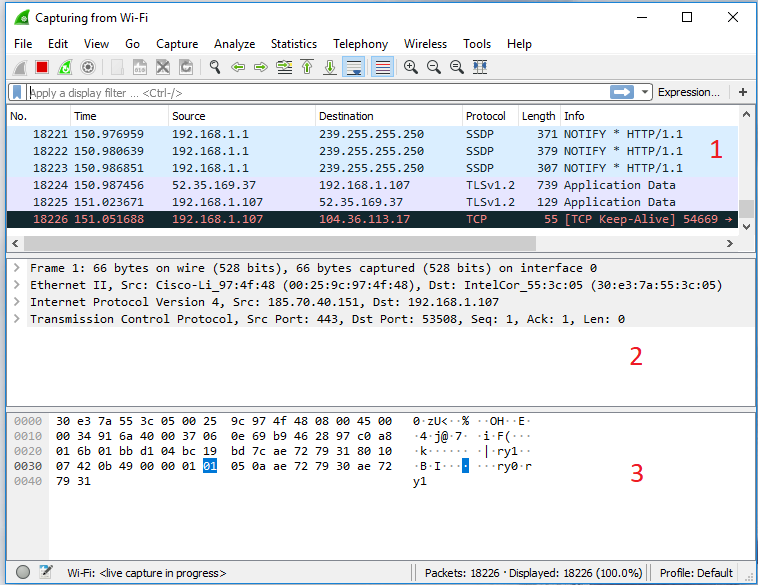
The middle window, labeled #2 and is know as the Packet Details Pane. This pane provides us with header information from the selected packet in Window #1.
Finally, Window #3, Packet Bytes Pane, provides payload information in both hexadecimal format to the left and ASCII format to the right.
Step #4: Creating Filters
In general, there will be way too much information to do a useful analysis. Packets are flying by hundreds or thousands per minute. To use Wireshark effectively, we need to filter the traffic to see just those packets we are interested in. Wireshark has a simple filtering language that you should understand to use it effectively and efficiently in a forensics investigation.
The packets flying by our interface are of many different protocols. Probably the first filter we would want to apply is a protocol filter. Remember, TCP/IP is a suite of protocols and we probably want to focus our analysis to just a few.
In the filter window, type “tcp”. You will notice that it turns green indicating that your syntax is correct (it remains pink when your syntax is incorrect). Now, click the arrow button to the far right of the filter window to apply the filter.
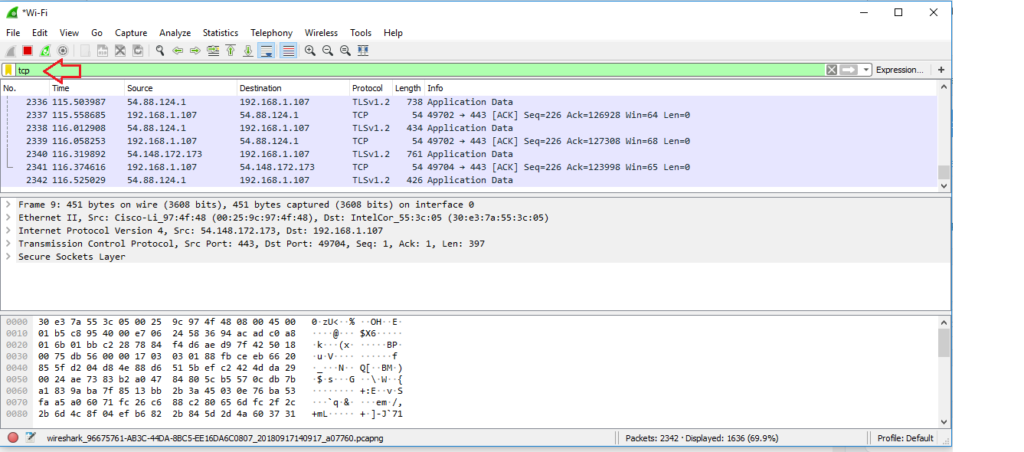
When you do, Wireshark will filter out all traffic, but the tcp traffic. You can do the same for just about any protocol such as “http”, “smtp”, “udp”, “dns” and many others. Try out a few and see what kind of traffic is passing your interface.
If we want to see traffic only from a particular IP address, we can create a filter that will only show traffic coming or going from that address. We can do by entering into the filter window;
ip.addr==<IP address>
Note the double equal sign (==) in the Wireshark filter syntax. A single = will not work in this syntax.
In my case here, I want to see traffic coming or going to IP address 192.168.1.107, so I create a filter like so;
ip.addr == 192.168.1.107
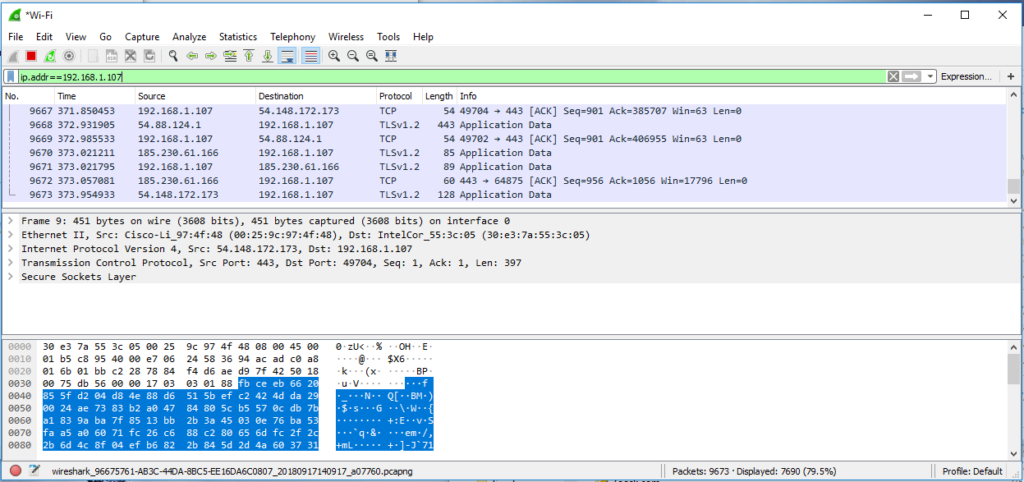
Now, you will see only traffic coming or going to that IP address. This allows me to narrow down my analysis to an IP of interest.
We can also filter traffic by port. If I want to see only TCP traffic destined for port 80, I can create filter like that below;
tcp.dstport==80
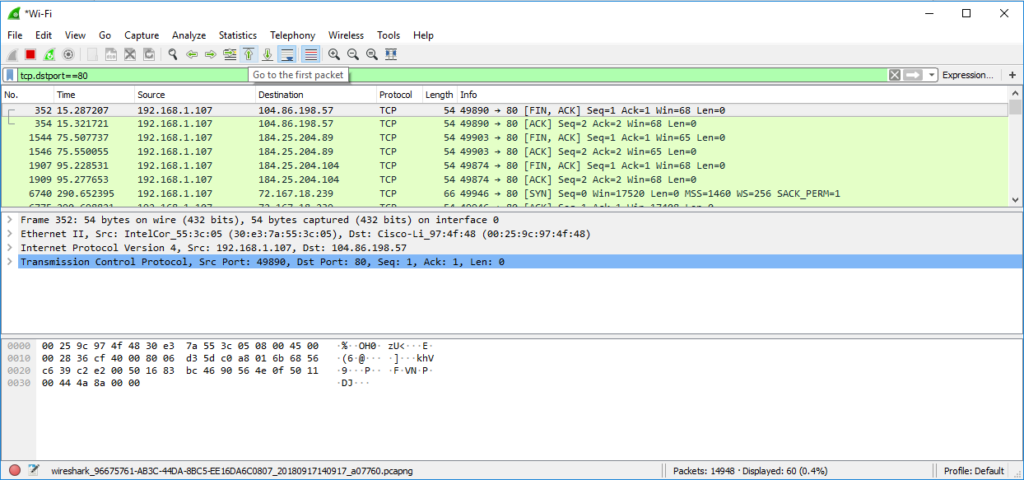
When creating filters, we will most often use == as the operator in our filter (there are others see below). This works fine as long as we are looking for one of the many fields in the protocol. If we are looking for strings in the payload, we have to use the “contains” operator. So, if I were looking for packets with the word Facebook in them, I could create filter like that below.
tcp contains facebook
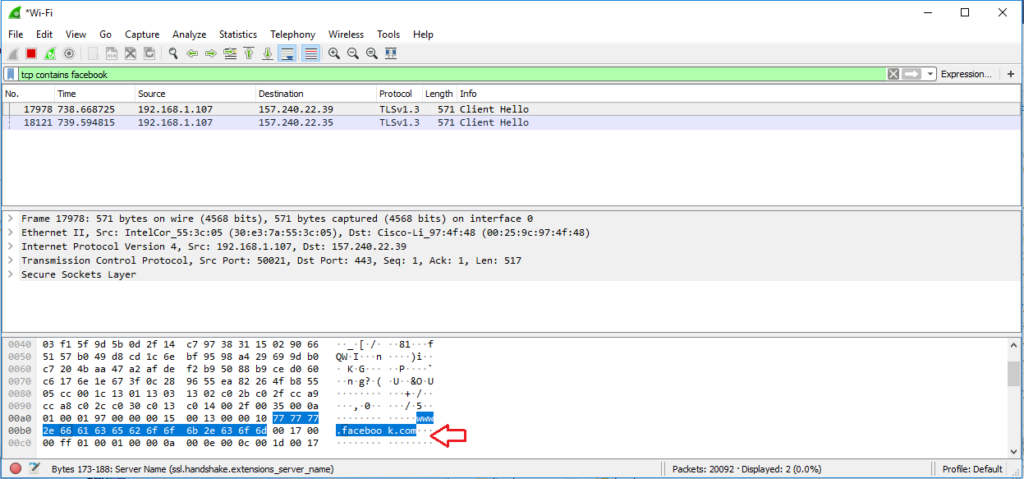
As you can see above, it only found two packets with the word Facebook in the payload and we can see the word Facebook in the ASCII display in the #3 pane.
Finally, we can click on the Expressions icon to the far right of the Filters window and it will open the Wireshark Display Filter Expressions window like below.
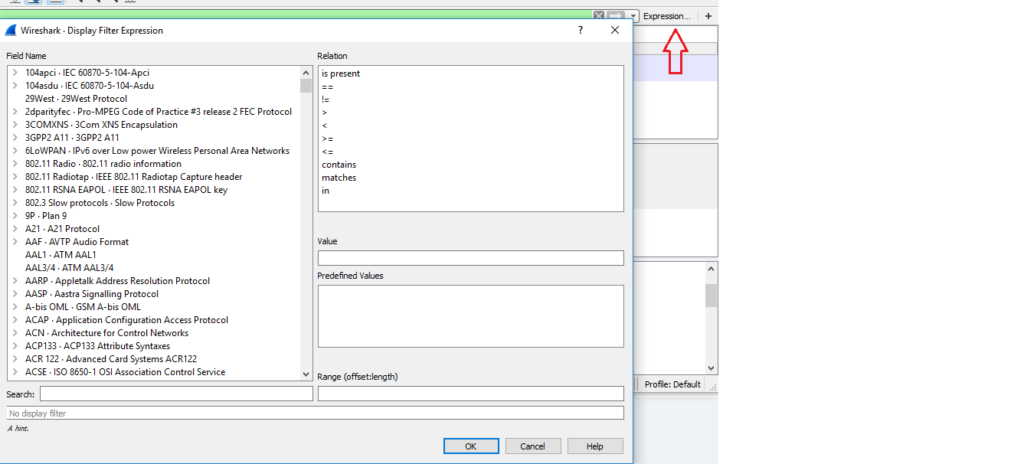
To the left of this window is the long list of fields that can be filtered for. These are hundreds of protocols and their included fields. You can expand a protocol and find all of its fields and select the field of interest.
The upper right hand window includes the Relation choices. These include;
Operator Description
== Equal to
!= Not equal to
> Greater than
< Less than
>= Greater than or equal to
<= Less than or Equal to
contains Protocol or Field contains a value
matches Protocol or text field matches a regular expression
Try creating filters using some of these other operators and fields to get a feel for what Wireshark can do for you.
Step #5: Following a Stream
It some cases, rather than examine all the packets of a particular protocol or traveling to particular port or IP, you will want to follow a stream of communication. Wireshark enables you do this with little effort. This can be useful if you are trying to follow a conversation of a rogue, disgruntled employee who is trying to do damage to your network, for instance.
To follow a stream, simply select a packet by clicking on it and then right click.
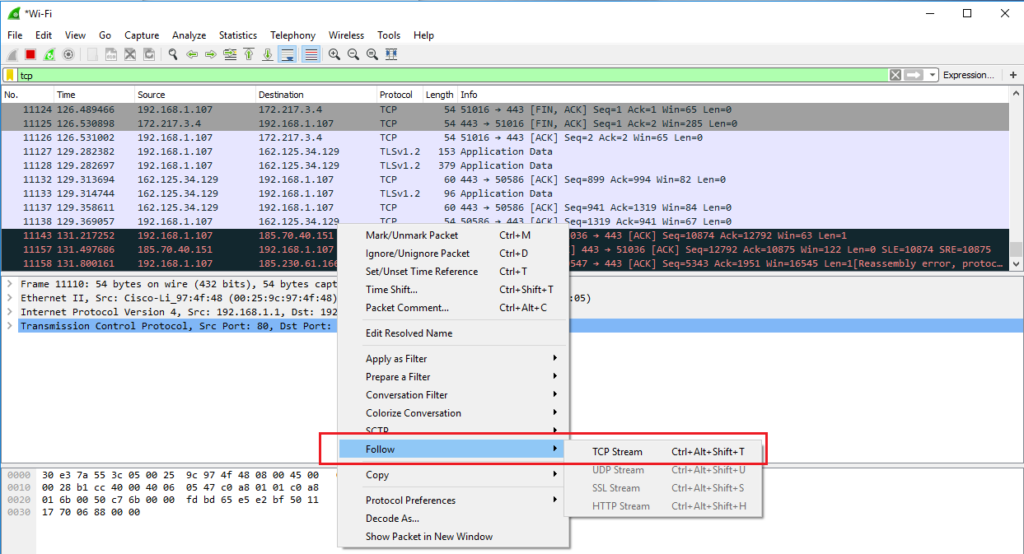
This will open a pull down window like that above. Click “Follow” and then “TCP Stream”.
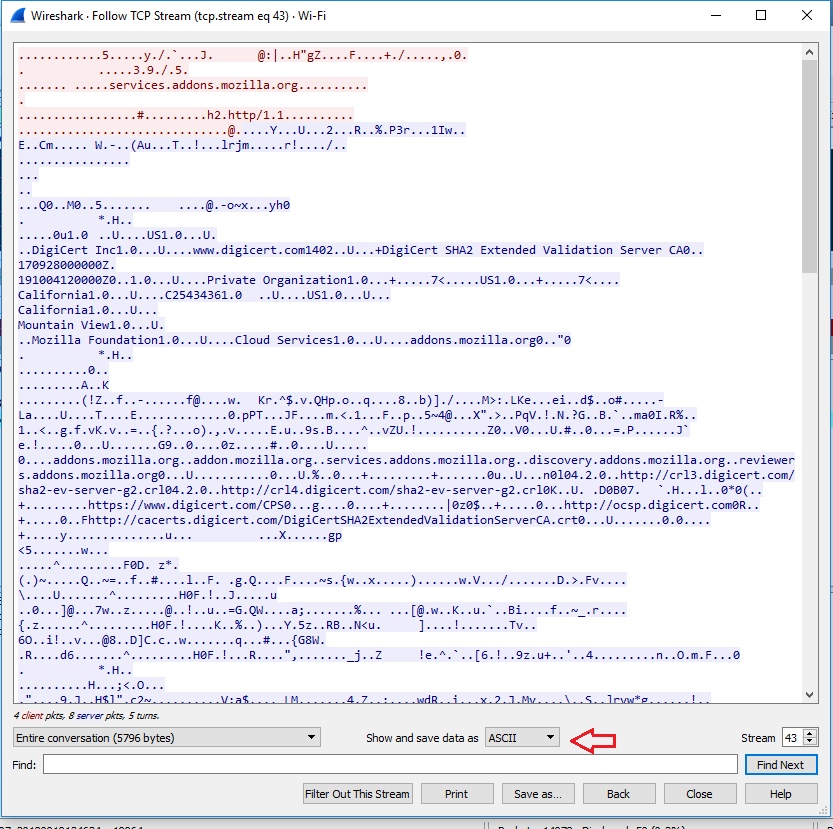
This opens a window that includes all the packets and their content in this stream. Note the statistics at the bottom of the window to the far left (5796 bytes) and the method of displaying the content (ASCII).
Step #6: Statistics
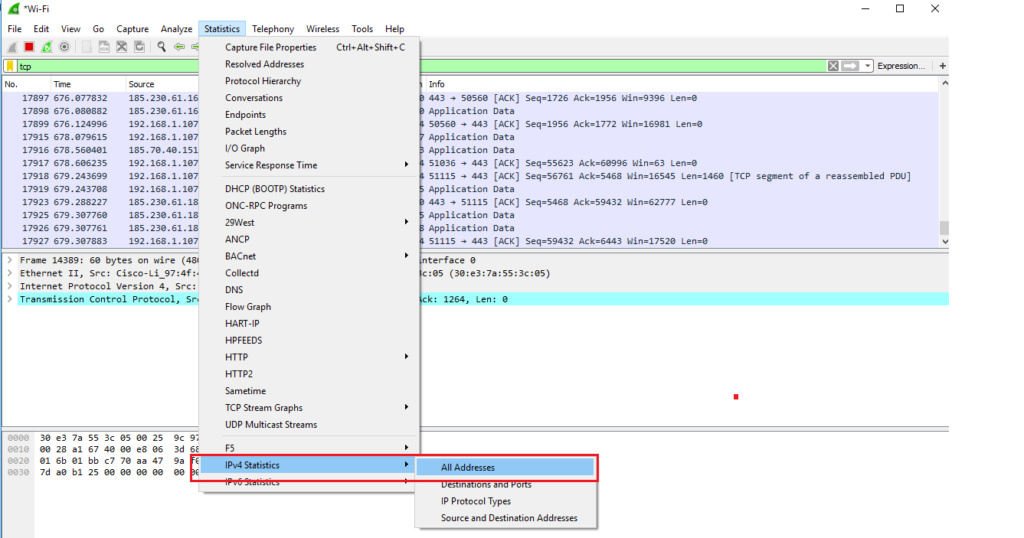
Finally, we may want to gather statistics on our packet capture. This can be particularly useful in creating a baseline of normal traffic. Simply click on the Statistics tab at the top of Wireshark and a pull down menu will appear. In our case, let’s navigate down to the IPv4 Statistics and then All Addresses.
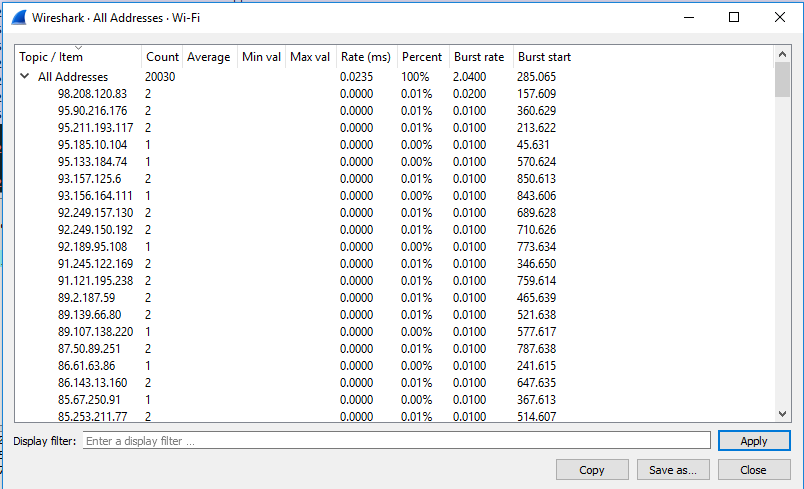
When we click, it will open a window like below that will display statistics for each and every IP address in our packet capture.
Wireshark is an essential tool for analyzing network traffic both for the network engineer but also the digital forensics investigator. Every digital forensic investigator should be conversant with this powerful tool.
For more on using Wireshark for network forensics, check out this article.
