Welcome back, my aspiring forensic investigators!
In this tutorial, we will use another tool that can be used in for live system forensics—Sysinternals—a suite of tools developed by Mark Russinovich. Many times as a forensic investigator, we need to examine a live system in a corporate investigation or incident response, without the need or the time to make a forensic image. In some cases, such a corporate policy violation or intrusion attempt, we are not preparing evidence for a criminal court, but simply want to decipher what was happening on a system immediately. Sysinternals can be great for such an analysis.
These tools proved so effective that Microsoft purchased them in 1996 and continues to provide them free of charge. Originally, they were all command line tools, but since Microsoft purchased them they have put some pretty GUIs on many of the tools.
These are some of the best tools for in-depth analysis of a system. They can be excellent for doing onsite forensics of a live system or incident response analysis of a system you suspect has been hacked. For the hacker who can get physical access to a system or upload these tools to a system, it can provide invaluable information on the potential target.
Windows Sysinternals is particularly useful when we suspect a system has been hacked and we are trying to understand what processes the malware is using and how it is operating.
Step 1: Install Sysinternals
As I mentioned earlier, Microsoft provides Windows Sysinternals for free, and you can download it here. Once you have install it, you can look in the SysinternalsSuite folder and see the numerous tools available. Here is a list of the tools (in alphabetical order) and their function.
AccessChk – Lets you see what type of access users and groups have to files, directories, registry keys, etc.
AccessEnum – Full view of your file system and registry security settings.
AdExplorer – Active Directory viewer and editor.
AdInsight – LDAP real-time monitoring tool used to troubleshoot Active Directory applications.
AdRestore – Ability to restore deleted Active Directory objects.
Autologon – Easily configure autologon mechanism.
Autoruns – Displays programs that are configured to run at startup.
BgInfo – Displays relevant information about the computer on the desktop, such as computer name, IP address, etc.
CacheSet – An applet to manipulate the working-set parameters of the system file cache.
ClockRes – Shows the resolution of the system clock.
Contig – Defragments a specified file or files.
Coreinfo – Shows you the mapping between logical processors and the physical processor.
Ctrl2Cap – Kernel-mode device driver that filters the system’s keyboard class driver.
DebugView – Monitors debug output on your local system.
Desktops – Allows you to organize up to four virtual desktops.
Disk2vhd – Creates VHD (virtual hard disk) versions of physical disks.
DiskExt – Returns information about what disks the partition of a volume is located on.
DiskMon – Logs and displays all hard disk activity.
DiskView – A graphical map of your hard drive.
DiskUsage (DU) – Reports the disk space usage for a specified directory.
EFSDump – Allows you to see who has access to encrypted files.
FindLinks – Reports the file index and hard links that exist for a specified file.
Handle – Displays information about open handles for any process.
Hex2dec – Converts hex to decimal and vice versa.
Junction – Creates junctions (symbolic links that combine directories from multiple locations).
LDMDump – Let’s you examine exactly what is stored in a disks copy of the system.
ListDLLs – Reports the DLLs that are loaded into processes.
LiveKd – Allows you to run the Kd and Windbg kernel debuggers.
LoadOrder – Shows the order in which the system loads device drivers.
LogonSessions – Lists currently active logon sessions.
MoveFile – Dumps the content of the pending rename/delete value.
NTFSInfo – Shows you information about NTFS volumes.
PageDefrag – Shows you have fragmented your paging files and registry hives are.
PendMoves – Dumps the content of the pending rename/delete value.
PipeList – Lists the pipes.
PortMon – Monitors and displays all serial and parallel port activity.
ProcDump – Monitors CPU spikes.
Process Explorer – Shows information about which handles and DLL processes are loaded.
Process Monitor – Shows real-time file system, registry, and process/thread activity.
PsExec – Allows you to execute processes on remote systems.
PsGetSid – Allows you to translate SIDs to their display name and vice versa.
PsInfo – Gathers key information about the local or remote system including kernel build and the amount of memory.
PsPing – Implements ping functionality.
PsKill – Can kill processes on local and remote systems.
PsList – Displays information about processes, memory, and threads.
PsLoggedOn – This shows who is using what resources on a local or remote machine.
PsLogList – Allows you to login to remote systems in situations where security credentials do not permit it.
PsPasswd – Allows you to change an account password on local or remote systems.
PsService – A service viewer and controller for Windows.
PsShutdown – Allows you to logoff the console user or lock the console among other things.
PsSuspend – Allows you to suspend processes on the local or a remote system.
RAMMap – A physical memory usage analysis tool to see how Windows is assigning physical memory.
RegDelNull – Allows you to search for and delete registry keys.
Registry Usage (RU) – Reports the registry space usage.
RegJump – Opens Regedit directly to a specified registry path.
RootkitRevealer – Detects rootkits.
SDelete – Allows you to delete one or more files/directories or to cleanse the free space on a drive.
ShareEnum – Allows you to lock down file shares.
ShellRunas – Allows you to launch programs under different accounts.
SigCheck – Shows file version number, timestamp, and digital signature details.
Streams – Allows you to see which NTFS files have alternate streams associated with them.
Strings – Searches files for a specified string.
Sync – Allows you to flush all file system data to disk.
TCPView – Shows detailed listings of all TCP and UDP endpoints on your system.
VMMap – A process virtual and physical memory analysis tool.
VolumeID – Allows you to change the IDs of FAT and NTFS disks.
WhoIs – Performs a registration record for the specified domain name or IP address.
WinObj – Displays information of the NT Object Manager’s name space.
ZoomIt – A screen zoom and annotation tool for technical presentations.
As you can see from this list, there are some very powerful tools in this suite. Let’s examine one of the most useful tools in this toolkit, Process Explorer.
Step 2: Open Process Explorer
In terms of digital forensics, Process Explorer can be one of the most useful Sysinternals tools. Simply click on the procexp icon in the SysinternalsSuite folder to get started.
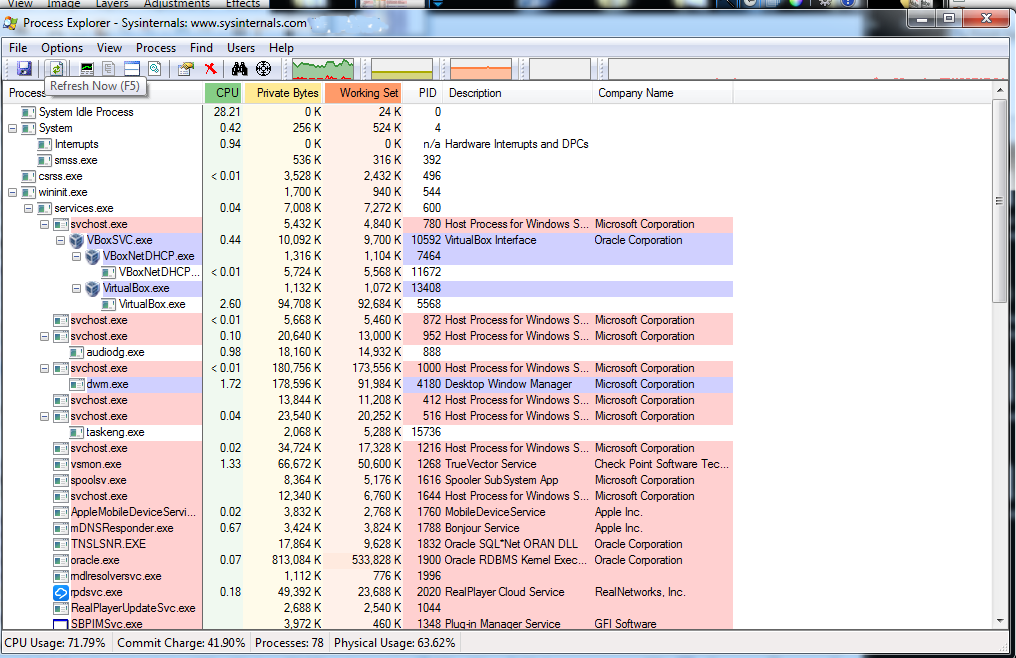
Process Explorer lists each and every process and its child processes, its CPU use, private bytes, working set, PID, description, and company. If we suspect a malware infection, we can often find evidence of it in the Process Explorer as you can see below.

Step 3: Use Process Explorer to Examine a Process
Let’s examine one process a bit closer. About two-thirds of the way down the following screenshot, you will see the Flash plug-in process which I suspect has been compromised.

As you know, Adobe’s Flash Player is probably the worst application for security—and the best application for hackers. Almost daily, new vulnerabilities and exploits are found in Flash Player. The problem is so severe that many firms that take security seriously are no longer allowing Flash Player in their organizations.
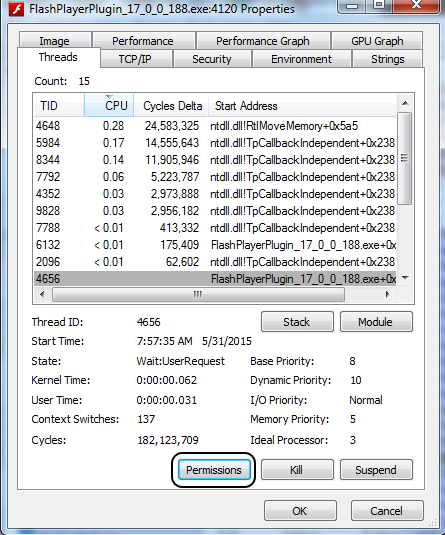
Let’s double-click on it and open its properties. As you can see in the screenshot below, this window reveals numerous properties of the selected process.

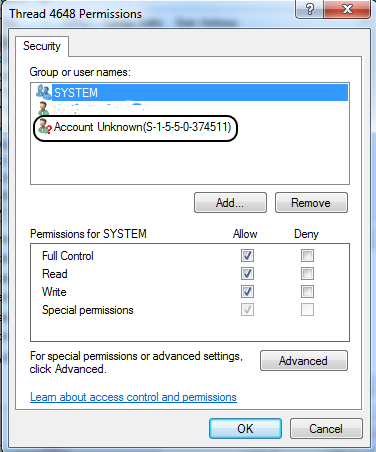
Now, we can click on Permissions to see who has permissions of this process. Notice in the screenshot below that besides System and the user (which I have obscured), an Unknown Account has permissions to use this process. Very suspicious! This would seem to warrant further investigation.

Step 4: Check Strings
Among the many bits of information we can glean from the process, we can extract any ASCII strings embedded in this process. Often, we can find key information about the process including any comments the developers left. Remember that when the FBI released the evidence against North Korea in the Sony hacking case, they cited comments within the malware code. This is one way they can extract those “strings.”
While in the properties window of Flash, we can simply click on the Strings tab to see any ASCII text within the process.

The Sysinternals suite of tools can be a very powerful for examining the inner workings of a Windows system and its processes. It’s worth investing the time of any digital forensic investigator, hacker, or system administrator in understanding these extraordinarily useful tools.


