Welcome back to my Reverse Engineering Malware course!
This course is designed for those of you who want to ascend to the pinnacle of Digital Forensics and Cyber Security.

There are many tools available for reverse engineering, but one disassembler stands alone. Nearly everyone in this industry uses IDA Pro to some extent. IDA Pro is a disassembler capable of taking binary programs where we don’t have the source code and creating maps and multiple modes of understanding the binaries. It takes source code and represents it as assembler code, so that we can better understand how the original code works. IDA Pro also has a a debugger, but we will focus primarily on its disassembly capabilities in this course.
IDA (Interactive Disassembly) Pro was first developed by Ilfak Guilfanov and sold now by his Leige, Belgium based firm, Hex-Rays. IDA Pro comes in a Windows version (which we will be using here) as well as Linux and MacOS versions.
Let’s get started with IDA!
Step #1 Download and Install
IDA Pro is commercial software, but you can download either the free version or the demo/evaluation version for this course. These versions have some limitations such as;
(1) they will only work on x86 and ARM platforms
(2) they will only work on PE/ELF/Macho-0 formats
(3) you can not save your results and it may time out
(4) a few other limitations.
After downloading IDA Pro, accepting the license agreement, installing Python 2.7, and installing Microsoft Visual C++, IDA pro will install to your system. It should now be in your programs at the Start button in Windows. Locate it and click on the icon. When you do so, IDA will start up with a screen like below. Click on “New”.

Step #2 Load a PE File
Since we are working with the demo version, we can only use Portable Executable (PE) files. We can now drag and drop a file into the working center window or click on File -> Open.

After selecting a file to disassemble and analyze, the window below will pop up. As you can see, IDA was able to automatically determine the type of file (portable executable) and processor type (x86). Click on “OK.”

When IDA begins its disassembly and analysis, it analyzes the entire file and places the information into a database. This database has four files:
.id0 – contains contents of B-tree-style database
.id1 – contains flags that describe each program byte
.nam – contains index information related to named program locations
.til – contains information about local type definitions
Whenever you go to close IDA, it will ask you whether you want to save these database files. If you do, these four files will be archived into a single IDB file. When people refer to the IDA database, this is what they are referring to. These files will be saved and available to you at any time. You will see these files saved in the same directory as the file you are analyzing.
Step #3 Start the Disassembly
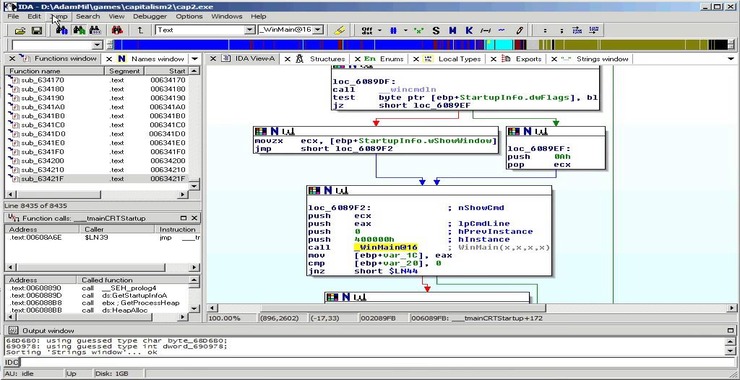
In this lab, I will be using small .exe file that is part of the Acunetix Web Vulnerability scanner. Its not malware, but it makes a good beginner demo. You can use any portable .exe (PE) that is 32-bit, so the demo version of IDA Pro can disassemble it. When we open it, IDA Pro begins its disassembly process and displays the information like in the screenshot below.

As you can see above, IDA provides us with some basic info in the IDA View tab. If we scroll down the IDA View, we can see every line of code. This is where we will do most of our work when we begin malware disassembly and analysis.
If we right-click, it displays the window shown below. Note that we can select Text View or any number of other options while in the IDA View. When we begin our analysis later in the course, we will be setting breakpoints in the code, F2.

The colorful bar above this IDA View represents the memory that the file is occupying. It color codes for the different parts of the program that are stored in each part of memory. If we right-click any part of the memory bar, we can zoom in to that segment of the code stored in memory. We are capable of zooming in right down to the single byte level.

We can view the file from many different perspectives by selecting any of these views available. These include the IDA View (as seen here), Hex View, Structures, Enums, Imports, and finally, Exports. By clicking on any one of those tabs, it will give us that particular view of the code (see Import in Step 5 below).

One of the most interesting and enlightening views that IDA can provide us is the flow chart. The flow chart graphically displays the flow of the execution of the file, making it easier to understand. We can open it by going to the top menu bar and clicking on View -> Graphs -> Flow Chart. It will open a Flow Chart of the code similar to that below.

We can zoom in by going to the View menu at the top of the flow chart to get greater detail. In this way, we can view the program flow from each register, subroutine, and function.

Step 5: Show Imports
When we select the Imports view, IDA will show us all the modules that the .exe imported. These imports can give us clues as to the origin of the malware.

Step 6: Customize the Analysis
Finally, we can begin to customize what and how IDA displays the code to by going to Options -> General. A window like that shown in the screenshot below will enable us to customize our analysis.

Although this far from a complete and thorough introduction to IDA Pro, we are ready to use IDA Pro for some malware analysis! I will introduce additional concepts and techniques as you need them throughout the course.
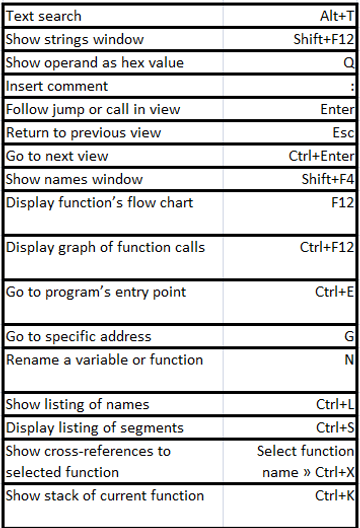
Before you proceed, I think it is useful to introduce you to a few key commands and shortcuts in IDA Pro.

Also, please find a complete IDA Pro Quick Reference sheet courtesy of the good folks at www.datarescue.com (the original sales and marketing firm for IDA Pro).


